When using computer-aided design, boundary conditions are essential. In IDEA StatiCa Connection basic analysis, EPS (stress/strain analysis) , ideally, only one end is supported, and the loads are in equilibrium. But how does it work in stiffness analysis?
Stress-strain analysis (EPS)
- Supports: There is one fixed support (all degrees of freedom are restrained) when the Loads in equilibrium setting is on (recommended).. If Loads in equilibrium is turned off, there is one fixed support for the ended member and two supports (at both ends) for the continuous member. Apart from fixed supports for the bearing member, additional supports may be added by model types for other members.
- Loads: The loads are applied to all the members except for one, which is selected as a bearing member.
- Member length: Members are composed of visible shell elements and condensed elements hidden from the user. By default, the shell element length is 1.25 times the cross-section depth. The condensed element is extending to 4 times the cross-section width.
- "Capacity" definition: Maximum safe load before failure.
Stiffness analysis (ST)
- Supports: All members, except for one selected as analyzed, are fixed.
- Loads: The load is applied only to the one selected analyzed member
- Member length: The member length in ST is shorter than in EPS. The condensed element part is only 2 times the cross-section depth or width, whichever is greater.
- "Capacity" definition: The point where stiffness drops to a specific limit, not failure.
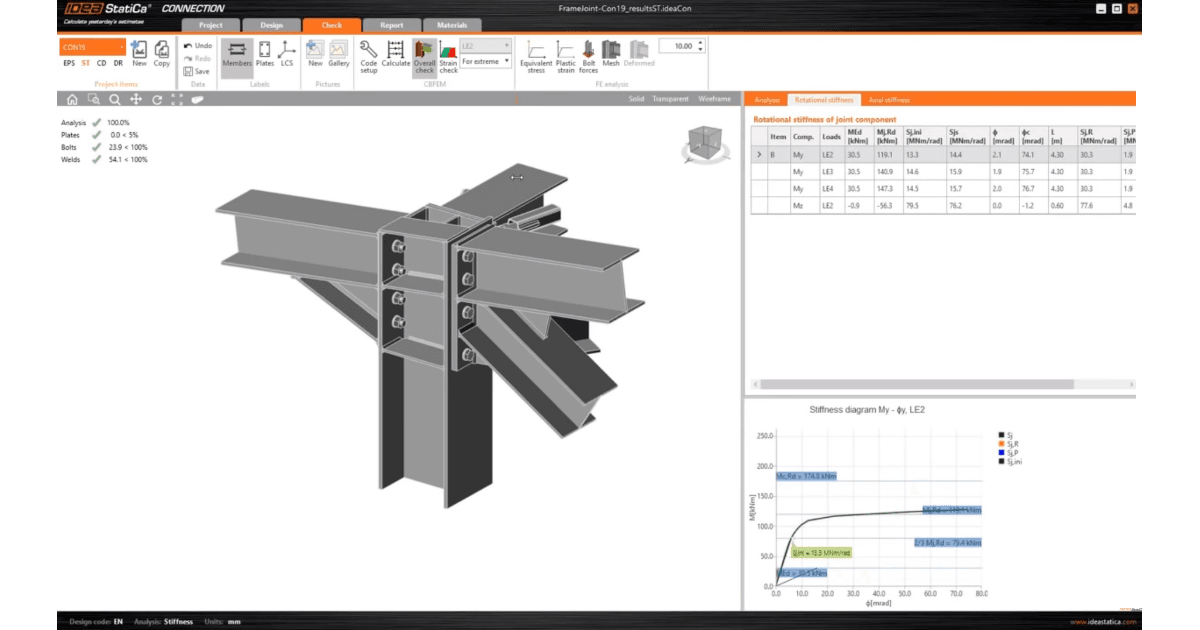
With that in mind, consider this simple welded beam-to-column connection.
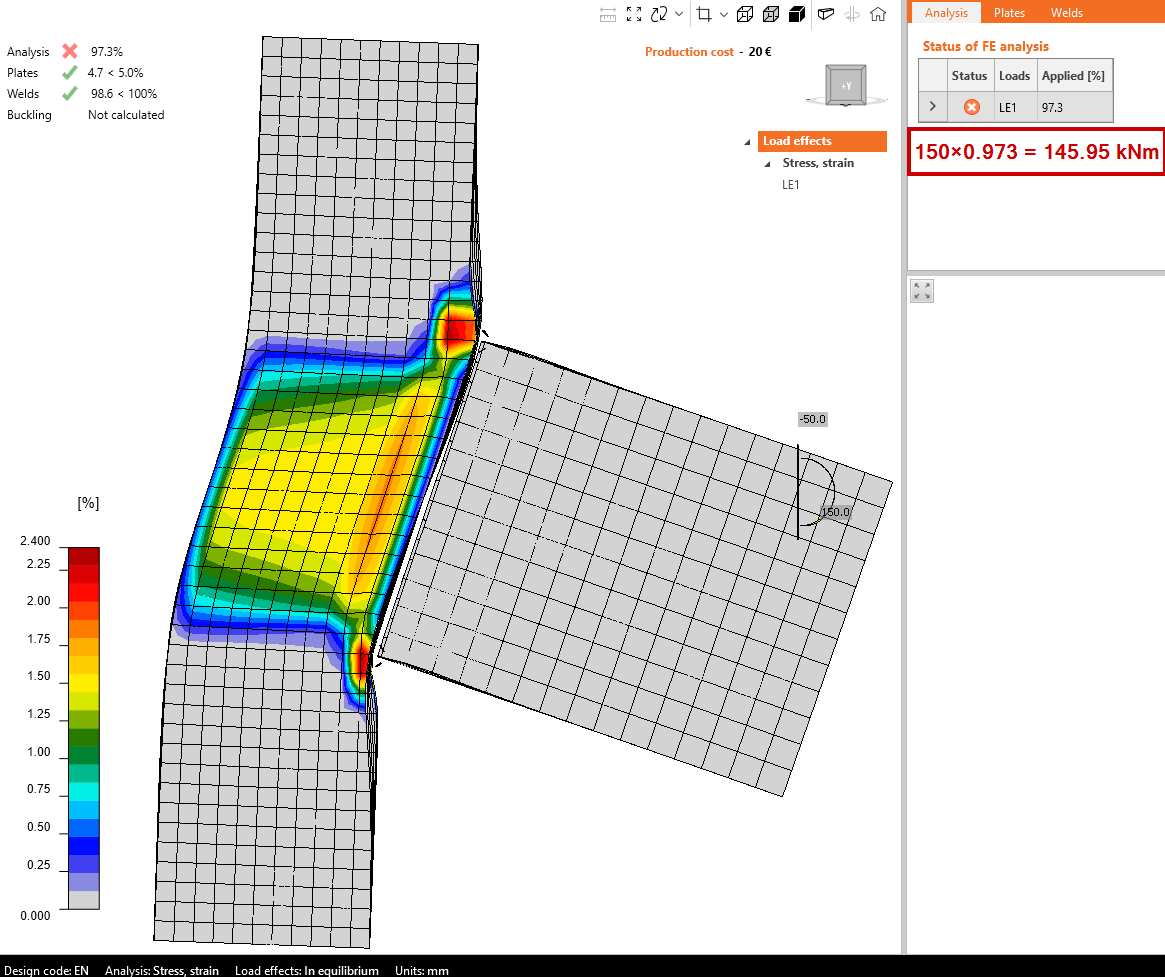
EPS calculation with loads in equilibrium shows a failure of the column web in shear with high stress concentrations, also in the column web from the transverse loads coming from the beam flanges (components column web in transverse compression and tension). Bending resistance equals 146 kNm.
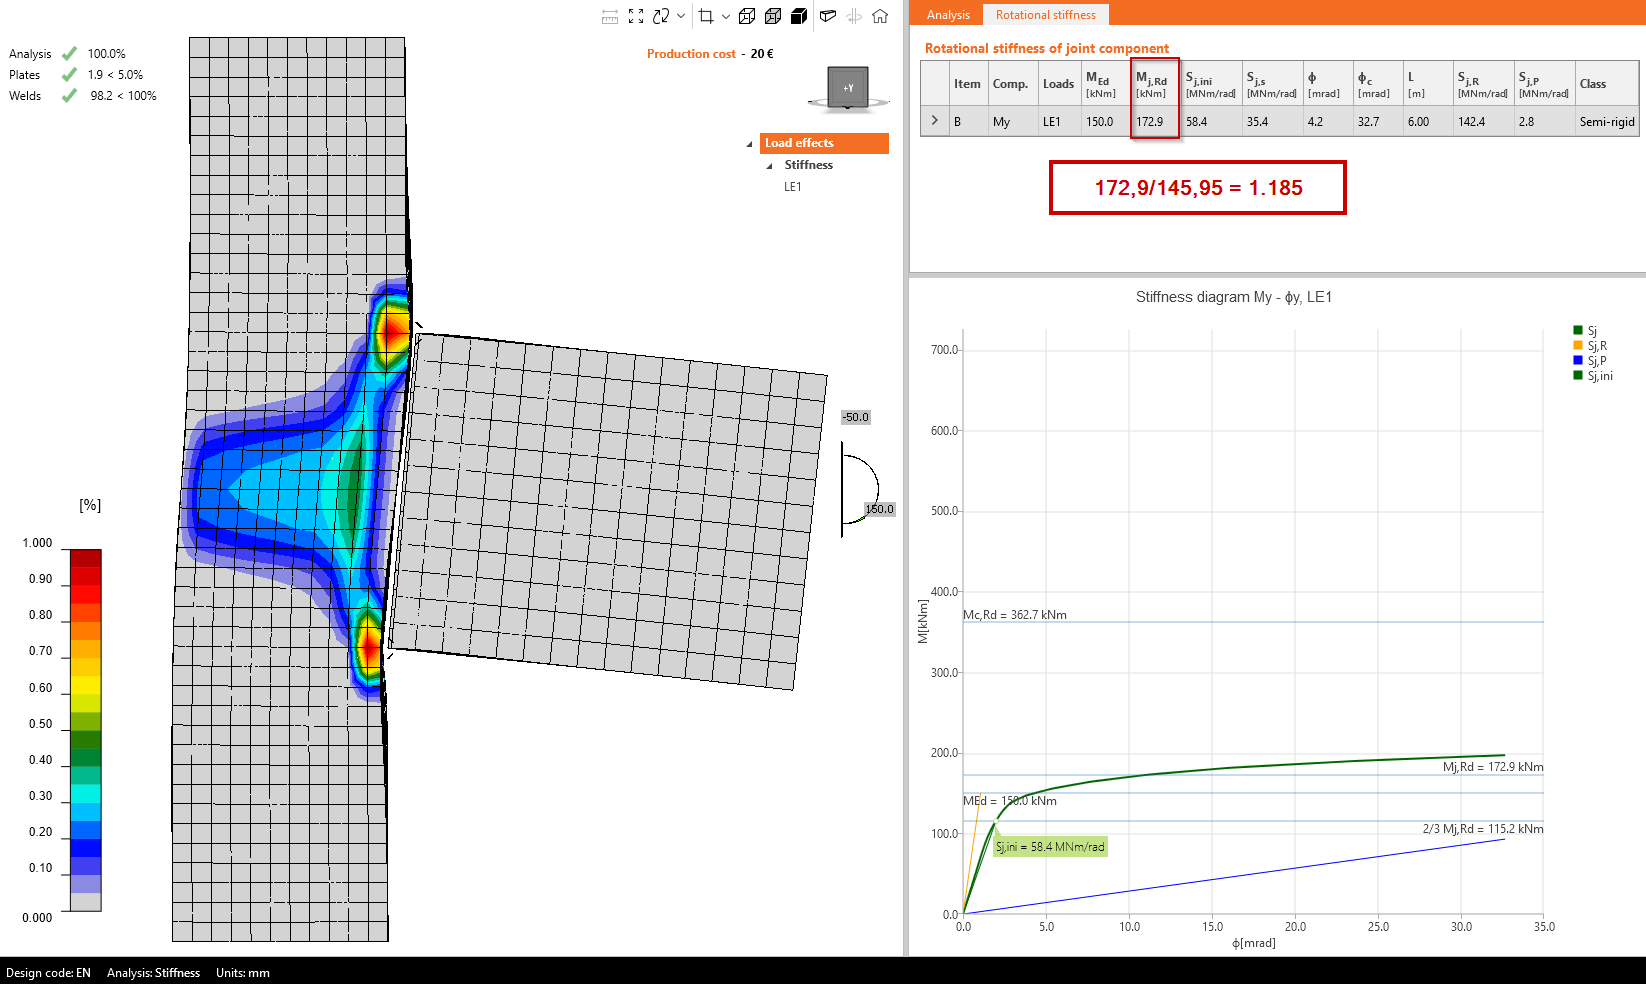
Looking at the results of the stiffness analysis, the stresses, especially in the column web in shear, are much lower despite more load acting on the beam, 150 kNm. Since the calculation is nonlinear, we should compare the ultimate bending resistances. And these are different by almost 20 %. Why does it happen? How does the analysis model behind the scenes look?
Stress/strain and Stiffness analysis differences
The EPS analysis allows for equilibrium of loads across the entire joint, whereas the ST analysis fixes all members except the one being analyzed. This difference in boundary conditions can lead to significantly different internal forces within the joint. For example, in ST analysis, part of the shear force acting on the column web is absorbed by the nearby top support. This effect is amplified when the column is shorter, as the support is positioned closer to the joint.
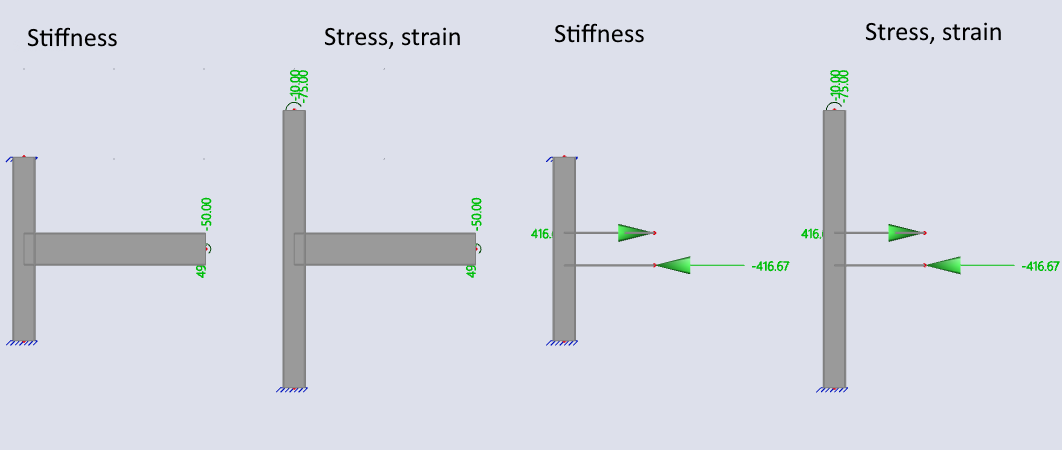
Let's look at the model behind the EPS and ST calculations in SCIA Engineer. You can see the differences in supports, loading, member lengths, and internal forces. There is always a series of four models. From left to right:
- Stiffness model
- Stress-strain model
- Stiffness model using only the top and bottom flanges to represent the beam
- Stress-strain model using only the top and bottom flanges to represent the beam
(Beam is web neglected to evaluate the influence on column web shear.)
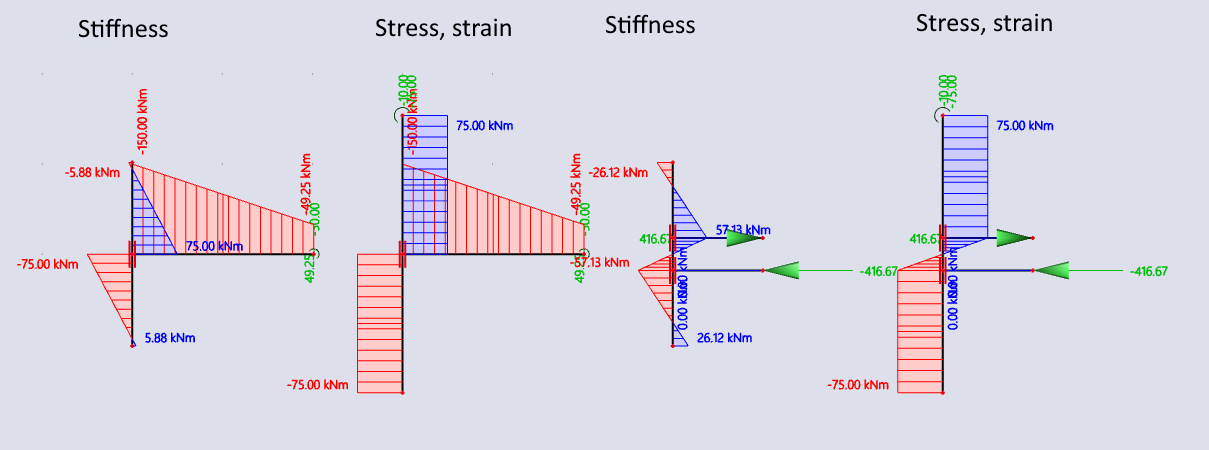
You may be surprised by the different forces. The IDEA StatiCa Connection model shows the users the forces in the node (if not chosen otherwise). In SCIA Engineering, the forces were applied at the member ends, i.e., the shear force stays constant at 50 kN and the bending moment is gradually decreasing from 150 kNm at the node to 49 kNm at the member end.
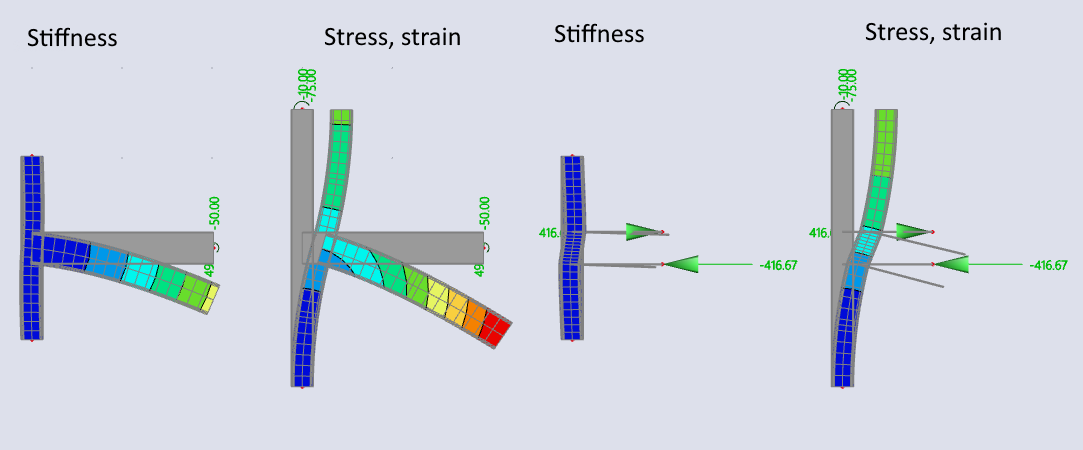
This is the shaded model with beam sizes visible:
This is the wireframe model with supports:
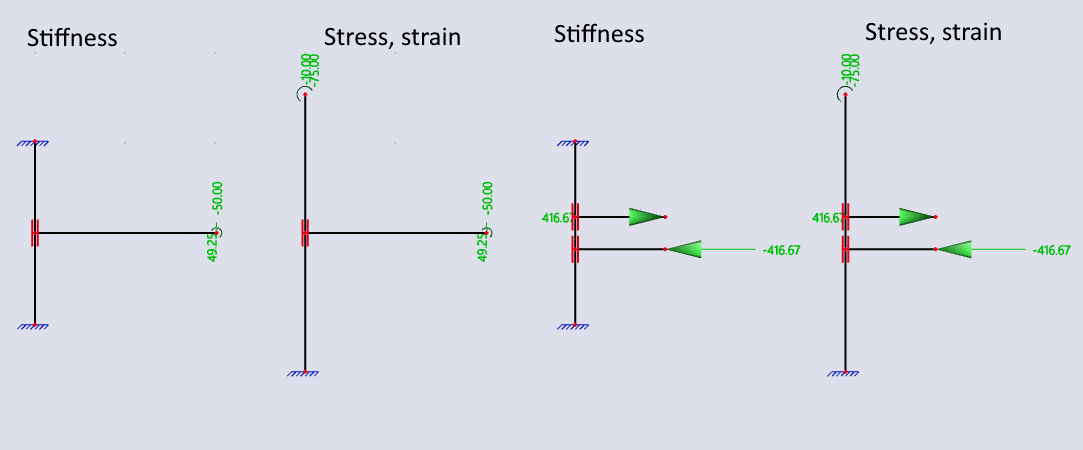
Here, the deformed shapes can be seen. Notice the clear difference between ST and EPS: The top of the column in ST is fixed and does not allow for movement or rotation.
Here are the internal forces: first, the bending moments.
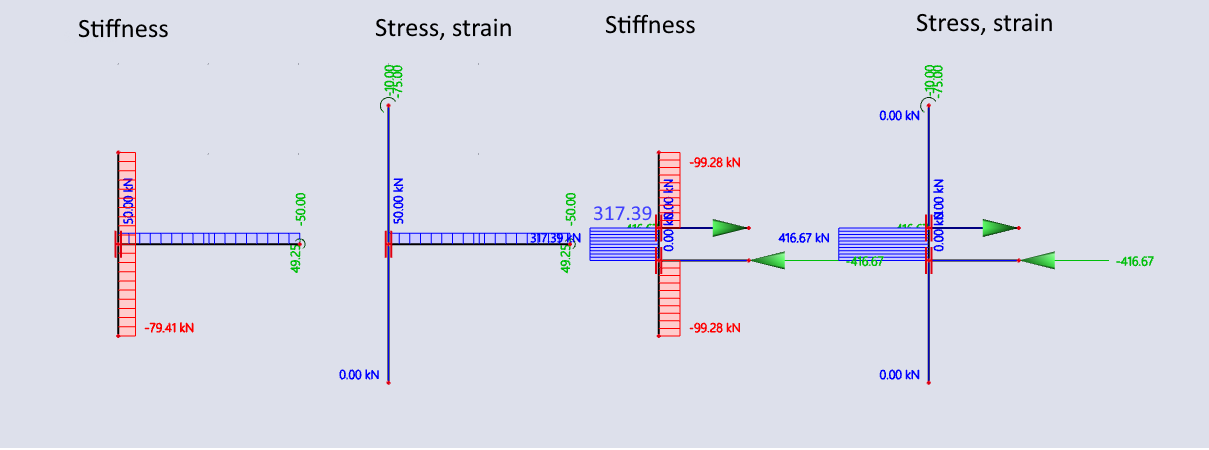
Secondly, consider shear forces. Notice the two models on the right: The shear forces in ST and EPS are 317.39 kN and 416.67 kN, respectively. The difference is 416.67/317.39=131%. Compare that to the difference between bending resistances: 172.9/145.95 = 118.5%. While these percentages aren’t identical, the variation in shear force is the primary reason for the difference in results between the two analyses.
When using IDEA StatiCa Connection, it’s essential to consider how supports are defined. Incorrect boundary conditions are one of the main sources of significant design errors and must be carefully reviewed to ensure accurate results.
Summary
The capacity values differ between stress/strain and stiffness analyses in IDEA StatiCa because they measure different things. Stress/Strain analysis shows the real strength of the connection—how much load it can carry before failing. Stiffness analysis, on the other hand, focuses on how flexible or rigid the connection is, not when it fails.
So if you see different capacity values, it's not a mistake—it's just two different ways of looking at the connection's behavior. Use both to get a full picture: strength and stiffness.