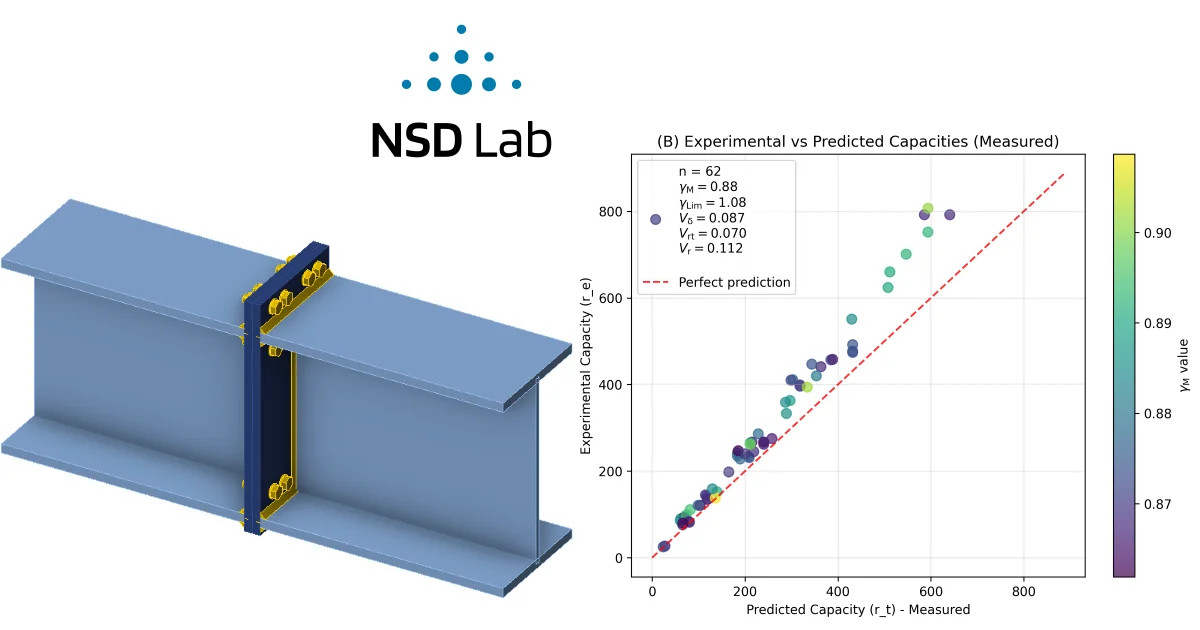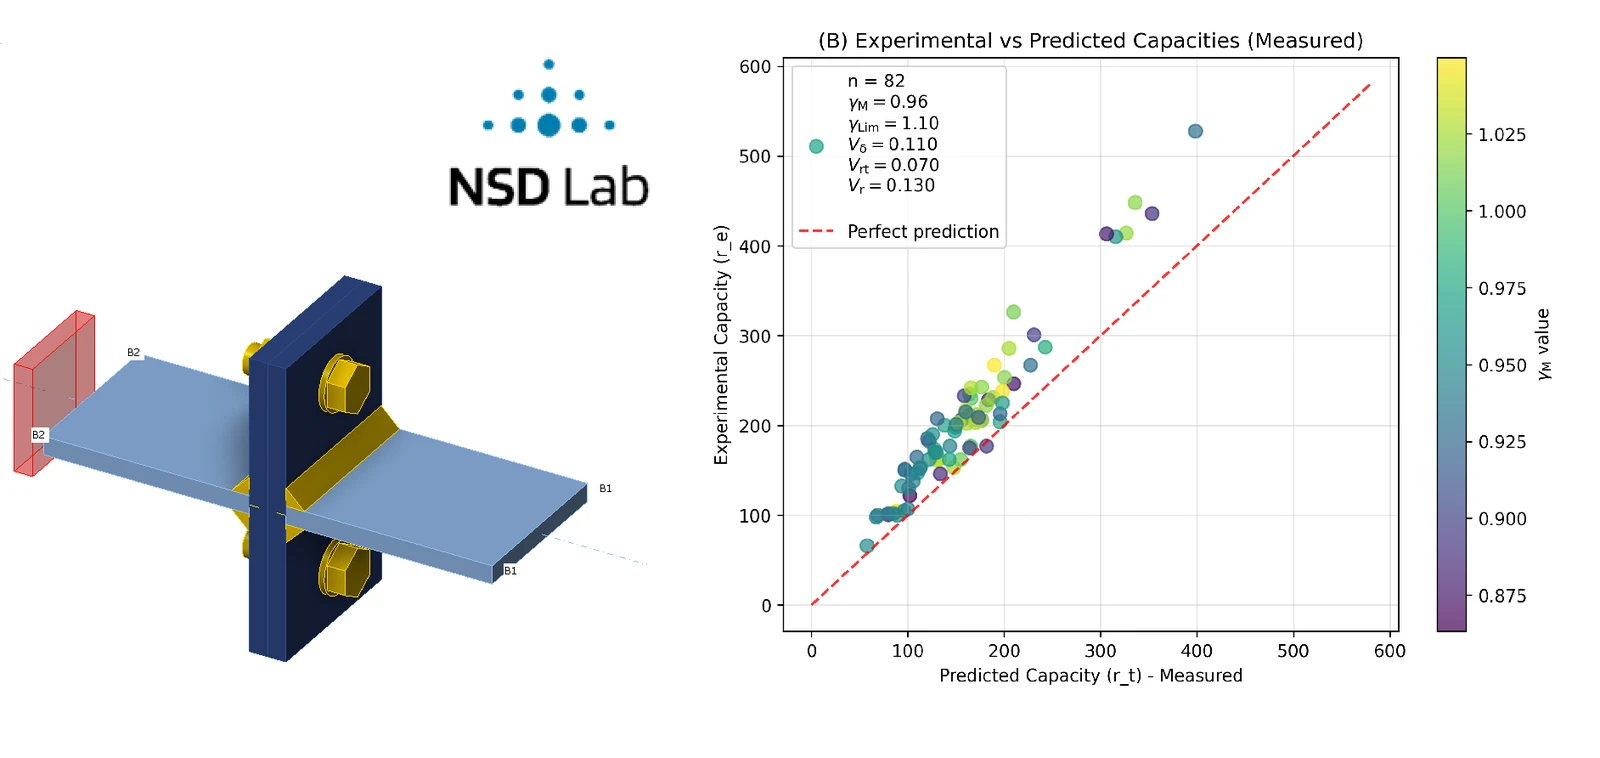
Summary of the experimental program
The experimental program considered T-stub connections subjected to tensile loading. The investigated T-stub specimens were symmetric, with identical plate thicknesses in both parts of the T-stub. The experiments were focused on the tensile behaviour and failure modes of these symmetric T-stub connections.
Table 1 below presents the authors of the studies containing experimental investigations, the year of publication, and the number of specimens considered from each experimental study.
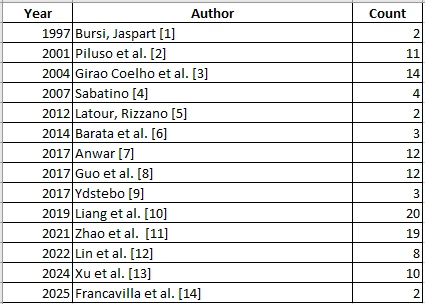
Table 1 . Number of specimens selected for validation from the respective studies
In some of the experimental studies, the T-stubs were manufactured from rolled T-sections, while in others, welded T-sections were used. The bolts connecting the two flanges of the T-stubs were arranged symmetrically, with either two or four bolts used in the connection. In all experiments, an axial tensile force was applied to the web of the T-stub.
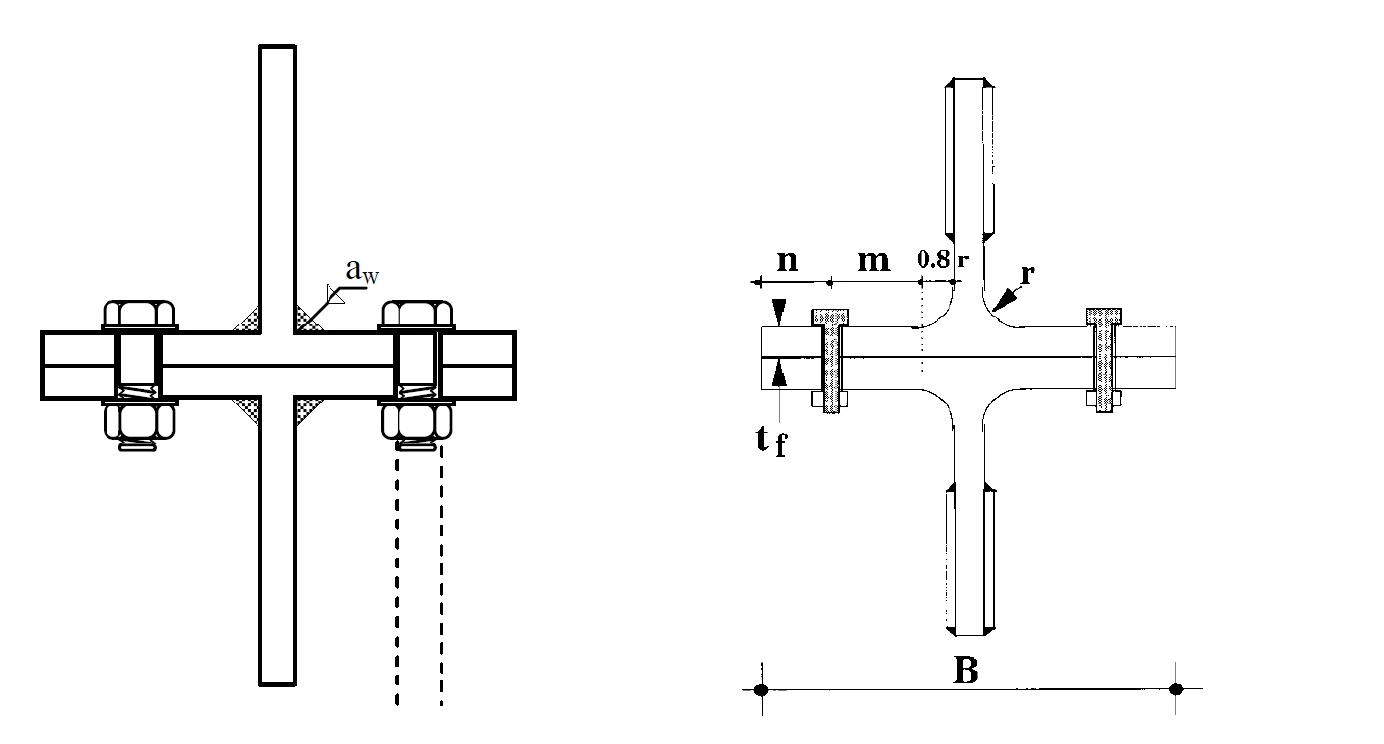
Figure 1 . Example of connection with welded section - Anwar G. (2017)[7] and rolled - Sabatino R. (2007)[4]
CBFEM models
All the T-Stub connections were modeled in accordance with the configurations and parameters described in the respective studies, using IDEA StatiCa Connection version 25.1.3. For experimental models, the plate material was converted to measured values, and the bolt and weld strengths were converted to mean values. All safety factors were set to 1, increasing the bolt and weld strengths compared to their standard design values.
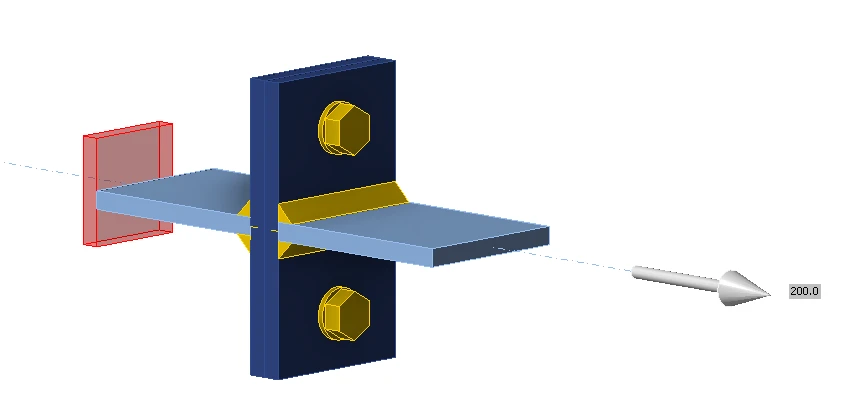
Figure 2. IDEA StatiCa model example
The whole database of collected T-stub experiments with measured material properties can be downloaded here:
Reliability assessment
The reliability assessment was performed according to EN 1990 – Annex D and the SAFEBRICTILE project [15]. This method requires three IDEA StatiCa models: with measured, nominal, and mean properties. To derive mean properties, EN 1993-1-1:2024 – Annex E: Basis for the calibration of partial factors was used.
| fy multiplier | fu multiplier | |
| S235 | 1.25 | 1.2 |
| Q235 | 1.25 | 1.2 |
| S275 | 1.25 | 1.2 |
| S355 | 1.2 | 1.15 |
| S690 | 1.1 | 1.1 |
| Q345 | 1.2 | 1.15 |
| Q690 | 1.1 | 1.1 |
| 8.8 | 1.1 | 1.1 |
| 10.9 | 1.1 | 1.1 |
Plate, weld, and bolt material properties were multiplied as shown in the table above to obtain mean models from nominal models. The partial safety factors are set to 1 with mean and experimental models but as default (e.g., ) for nominal models.
A total of 122 specimens were collected into the database of T-stub tests.
For T-stub connections subjected to tensile force, three failure modes may occur; see Figure 3. However, in the experiments selected for validation in this study, only either Mode 1 or Mode 2 was observed. Figures 4 and 5 below compare the failure patterns obtained using IDEA StatiCa with photographs of the corresponding experimental specimens.
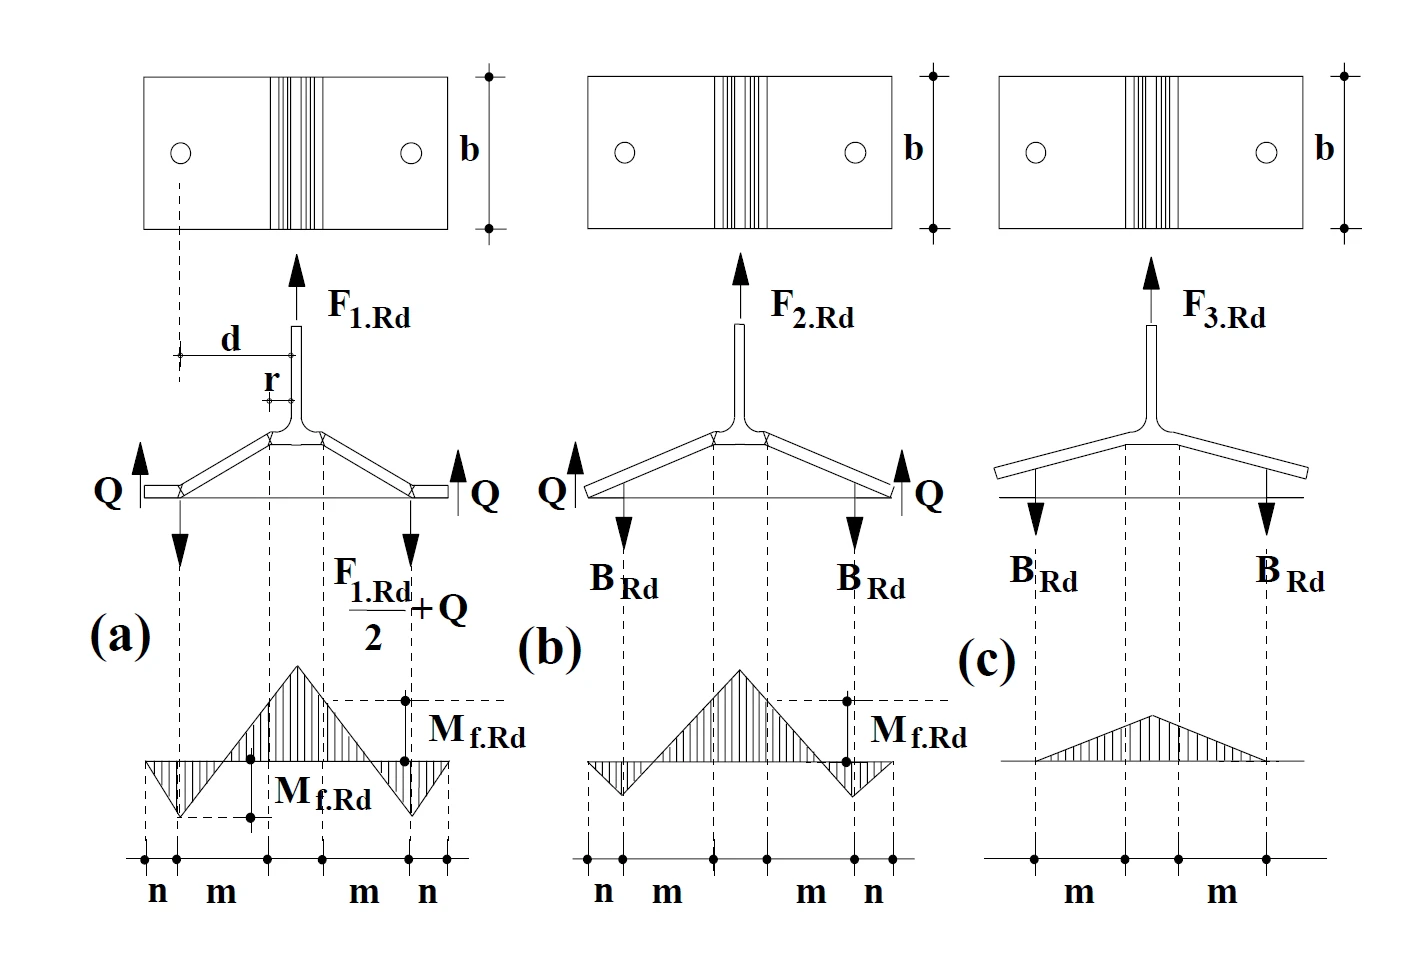
Figure 3. T-Stub failure modes - Sabatino R. (2007)[4]
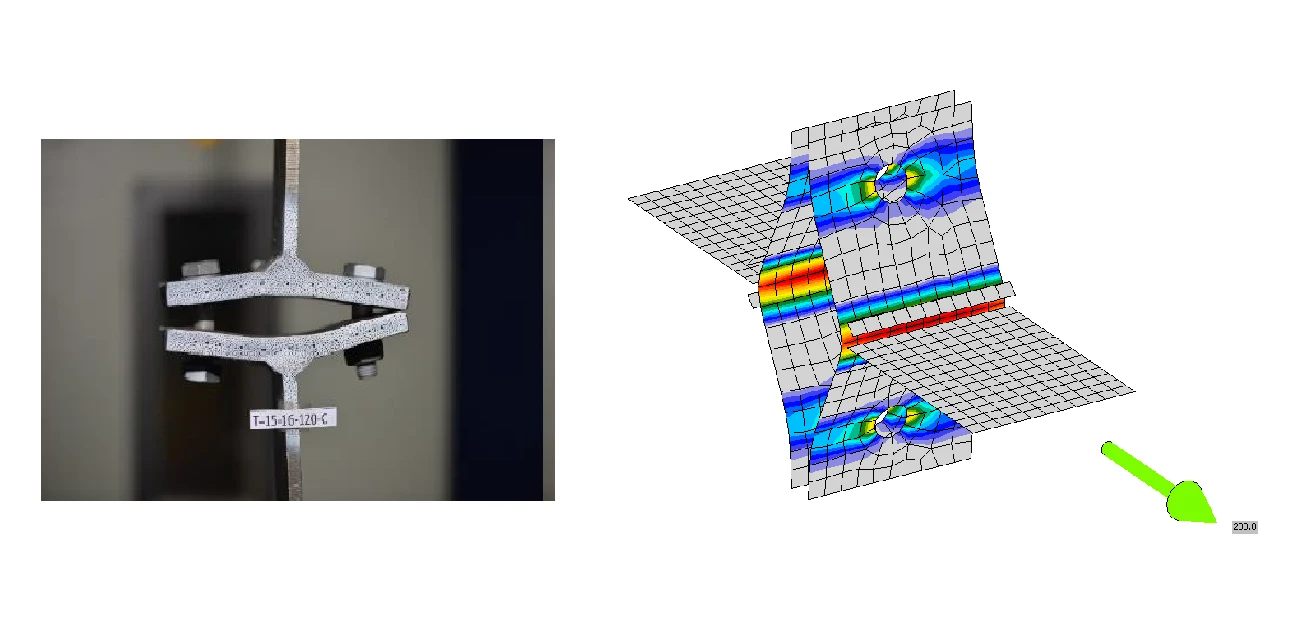
Figure 4. Failure mode 1 - Specimen T-15-16-120C Anwar G. (2017)[7]
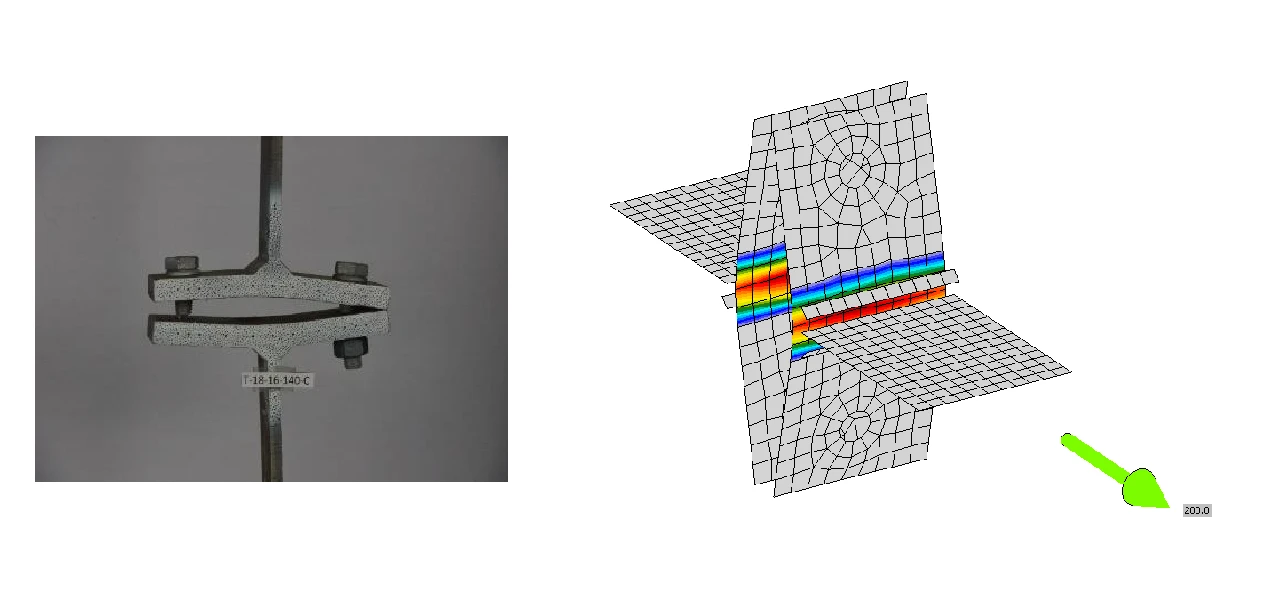
Figure 5. Failure mode 2 - Specimen T-18-16-140C Anwar G. (2017)[7]
Ratios of experimental-to-predicted resistances show big scatter; see Figure 6. A coefficient of variation of was obtained, which is added to the variation of the model due to basic variables, such as plate thickness or yield strength, , as used in standard Eurocode reliability assessments.
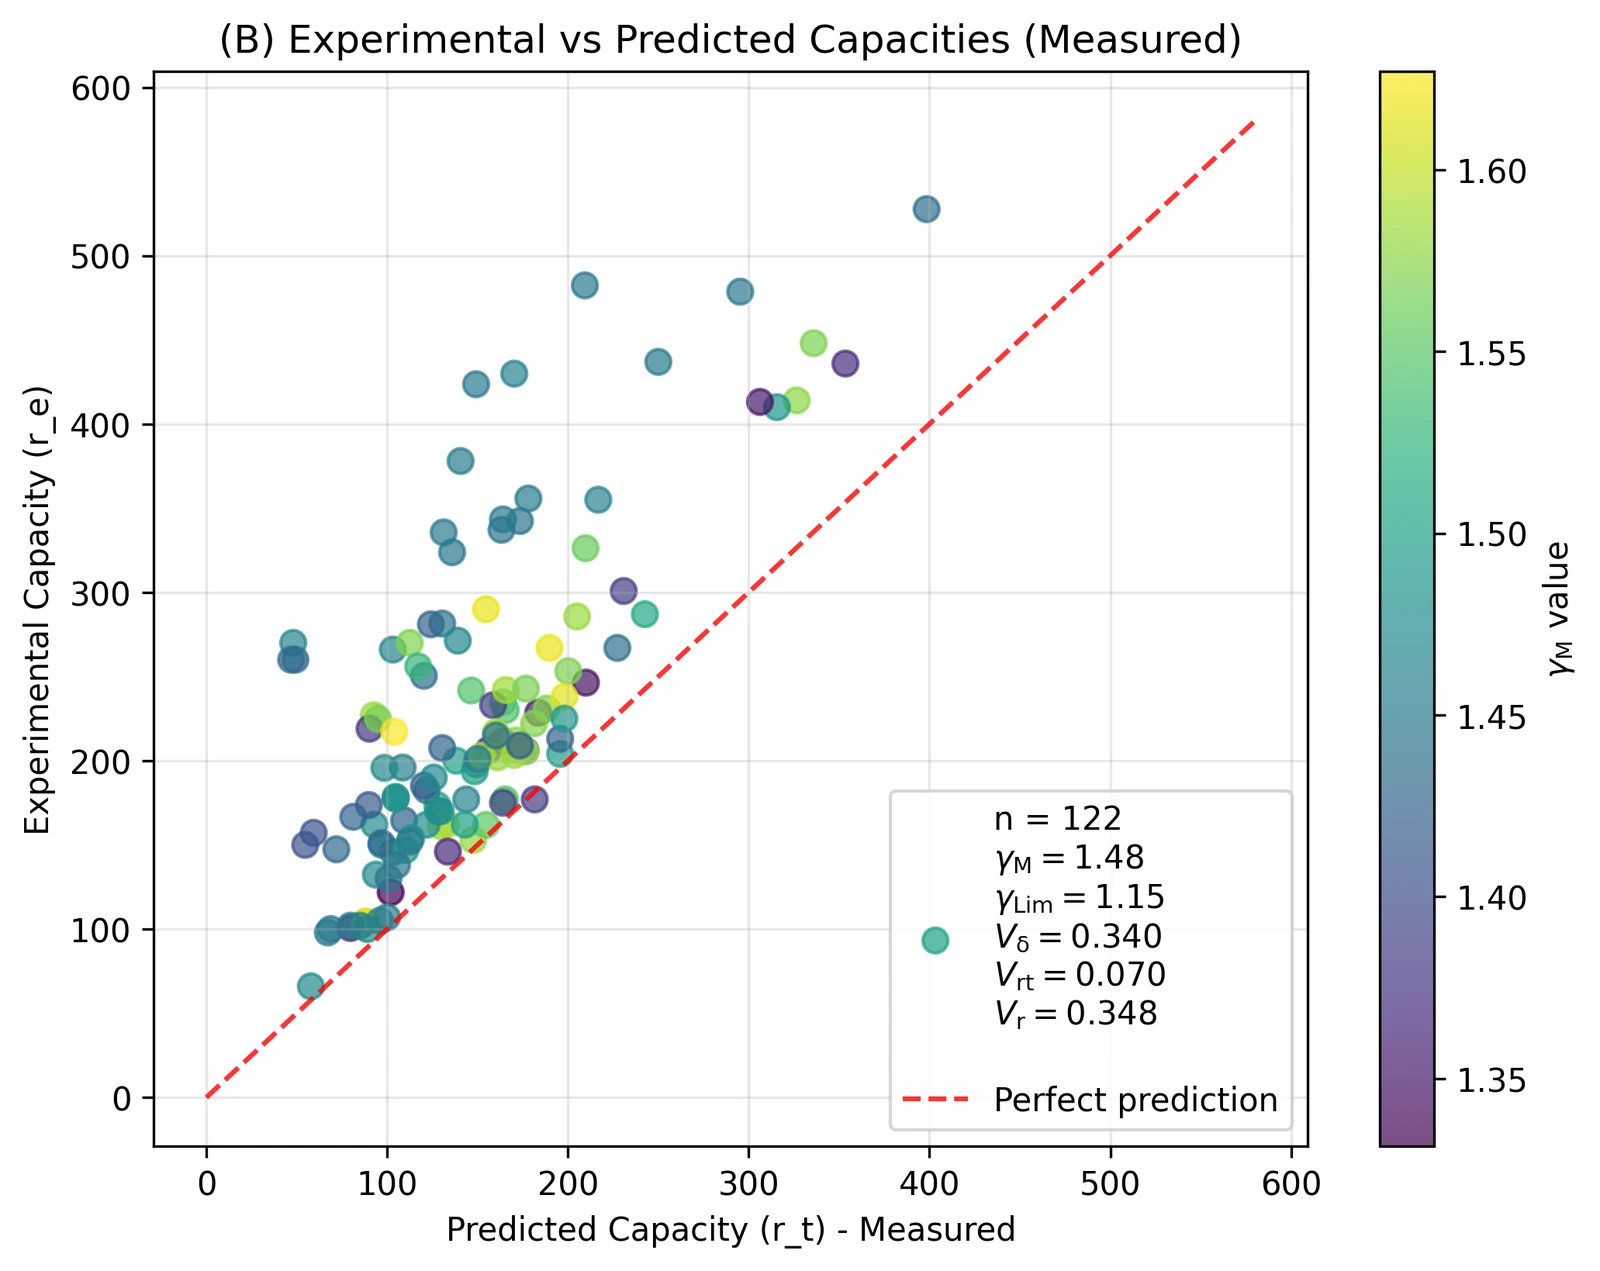
Figure 6. Reliability plot for all 122 specimens
The distribution of experimental-to-predicted (using measured properties) load resistances had a tail on the safe side. This means some specimens were able to transfer much higher loads than determined via CBFEM. Tail fitting was applied to achieve a distribution as close to normal as possible, as indicated by a Q-Q plot; see Figure 7. After removing the tail of 40 specimens with the highest experimental-to-predicted ratio, the number of specimens in the evaluation was reduced to 82. As specimens with the safest experimental-to-predicted ratios ( are removed, the bias () indicating the average safety of the prediction decreases, but also the coefficient of variation decreases; see Figure 8.
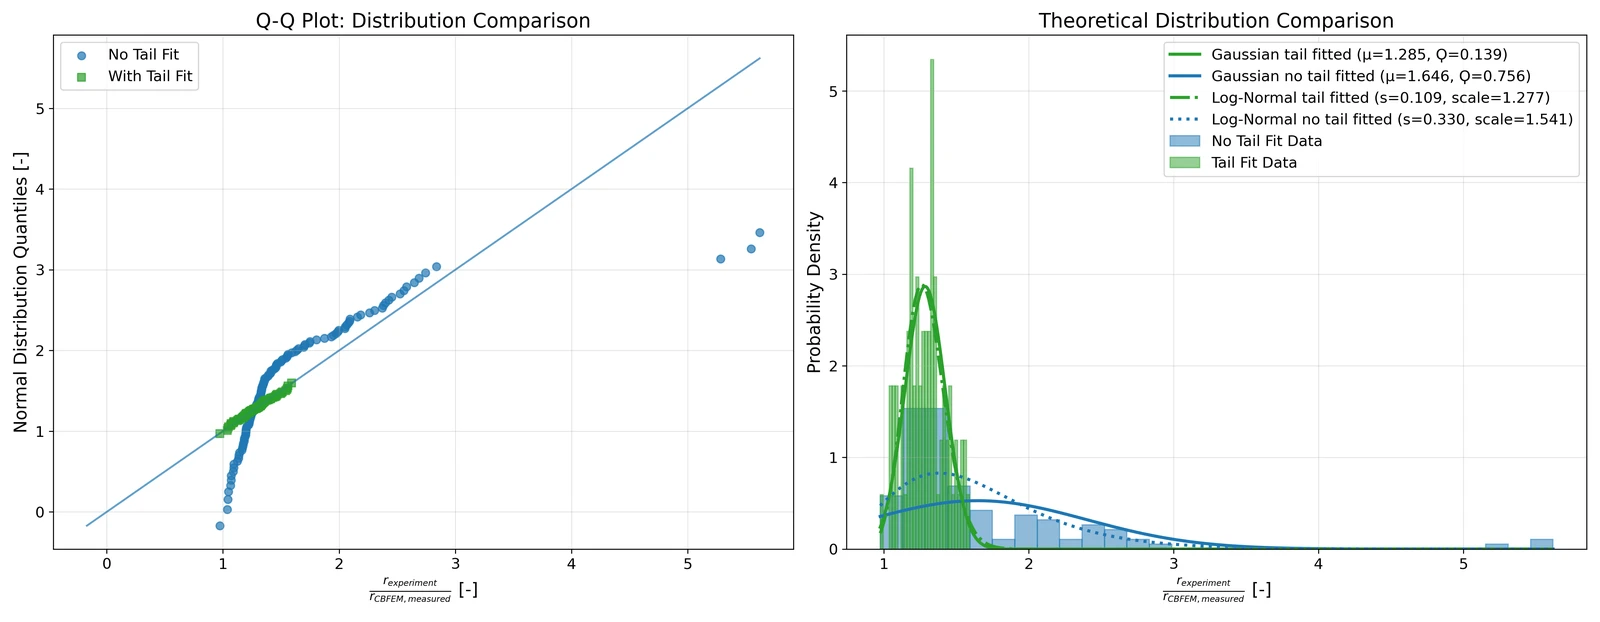
Figure 7. Q-Q plot and distribution of experimental-to-predicted ratios
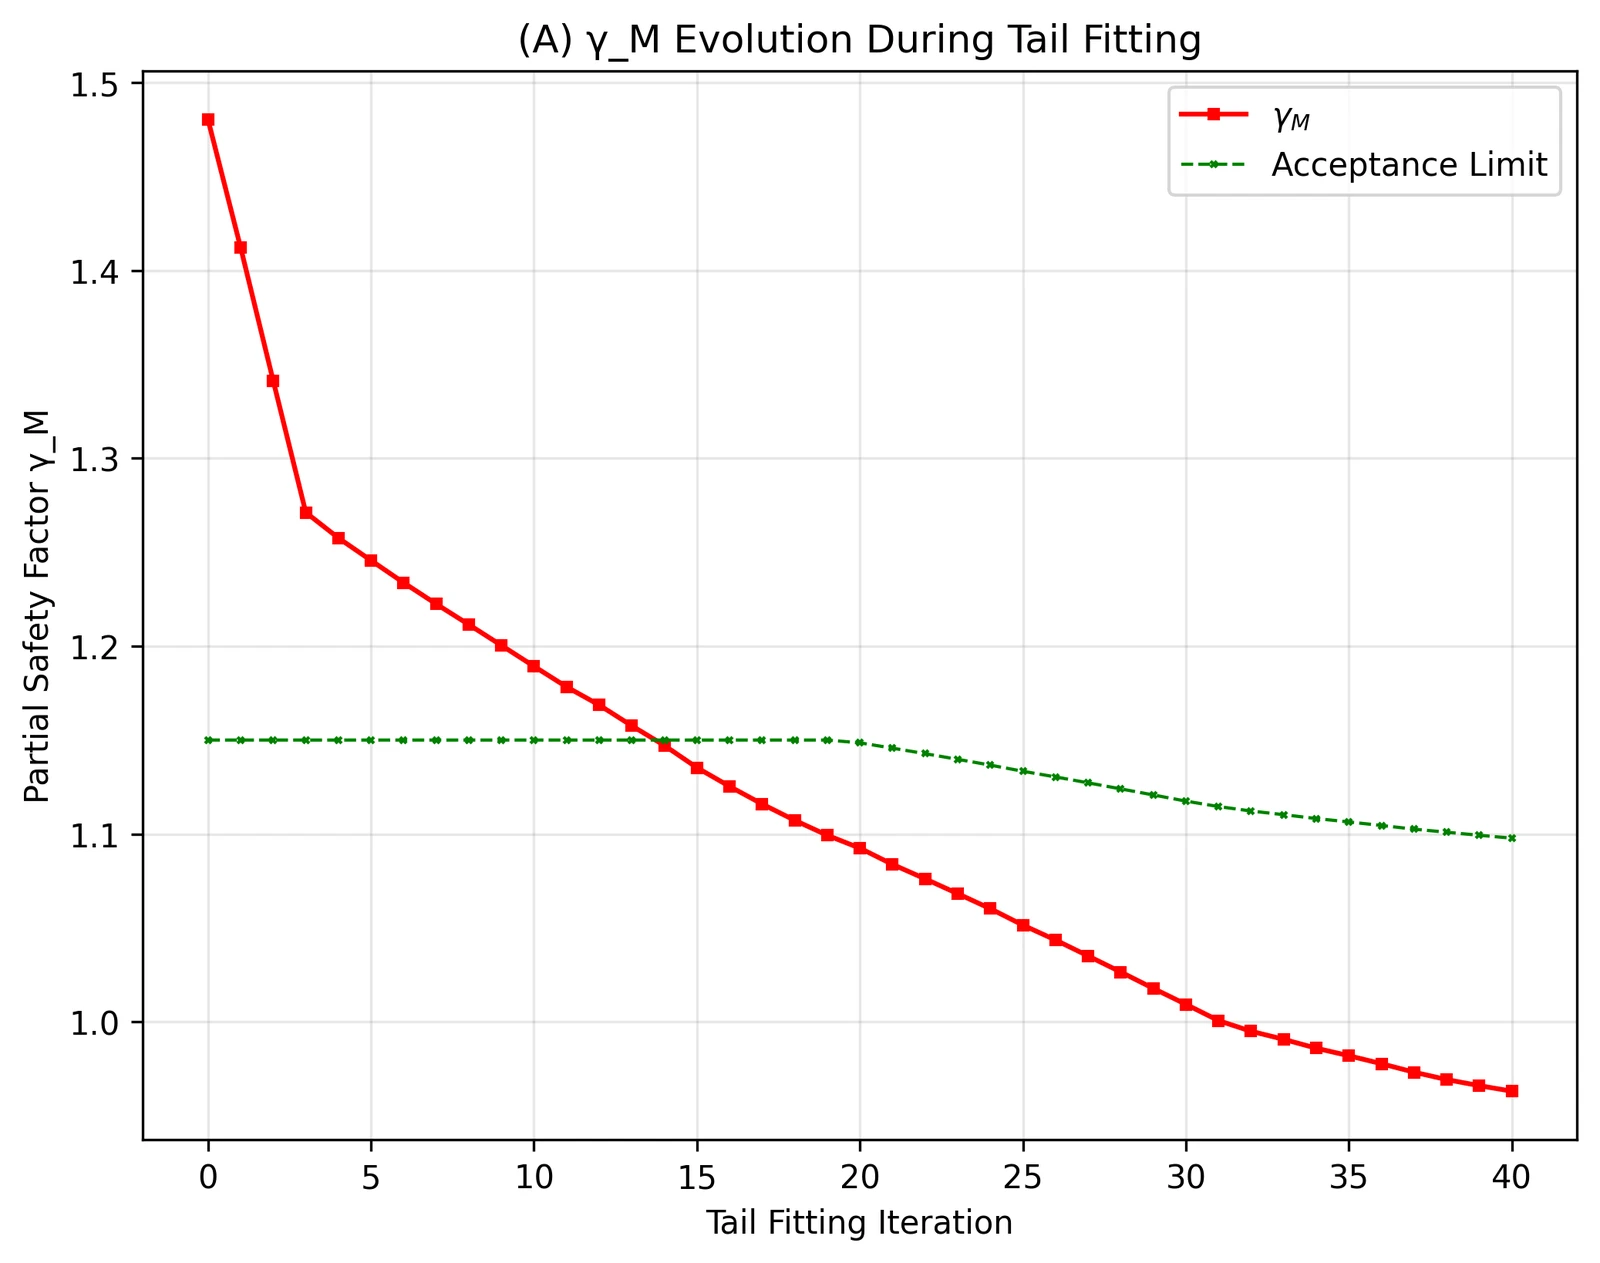
Figure 8. Tail fitting iterations: Evolution of
The design resistance obtained by the reliability assessment is calculated for each specimen, and the ratio of the resistance by the nominal model and reliable design resistance is the safety factor . The average of all specimens is accepted as the safety factor for the whole set.
After tail fitting of 40 specimens, a coefficient of variation of was obtained. The value of was equal to 0.96, which is below the limit from SAFEBRICTILE [15] .
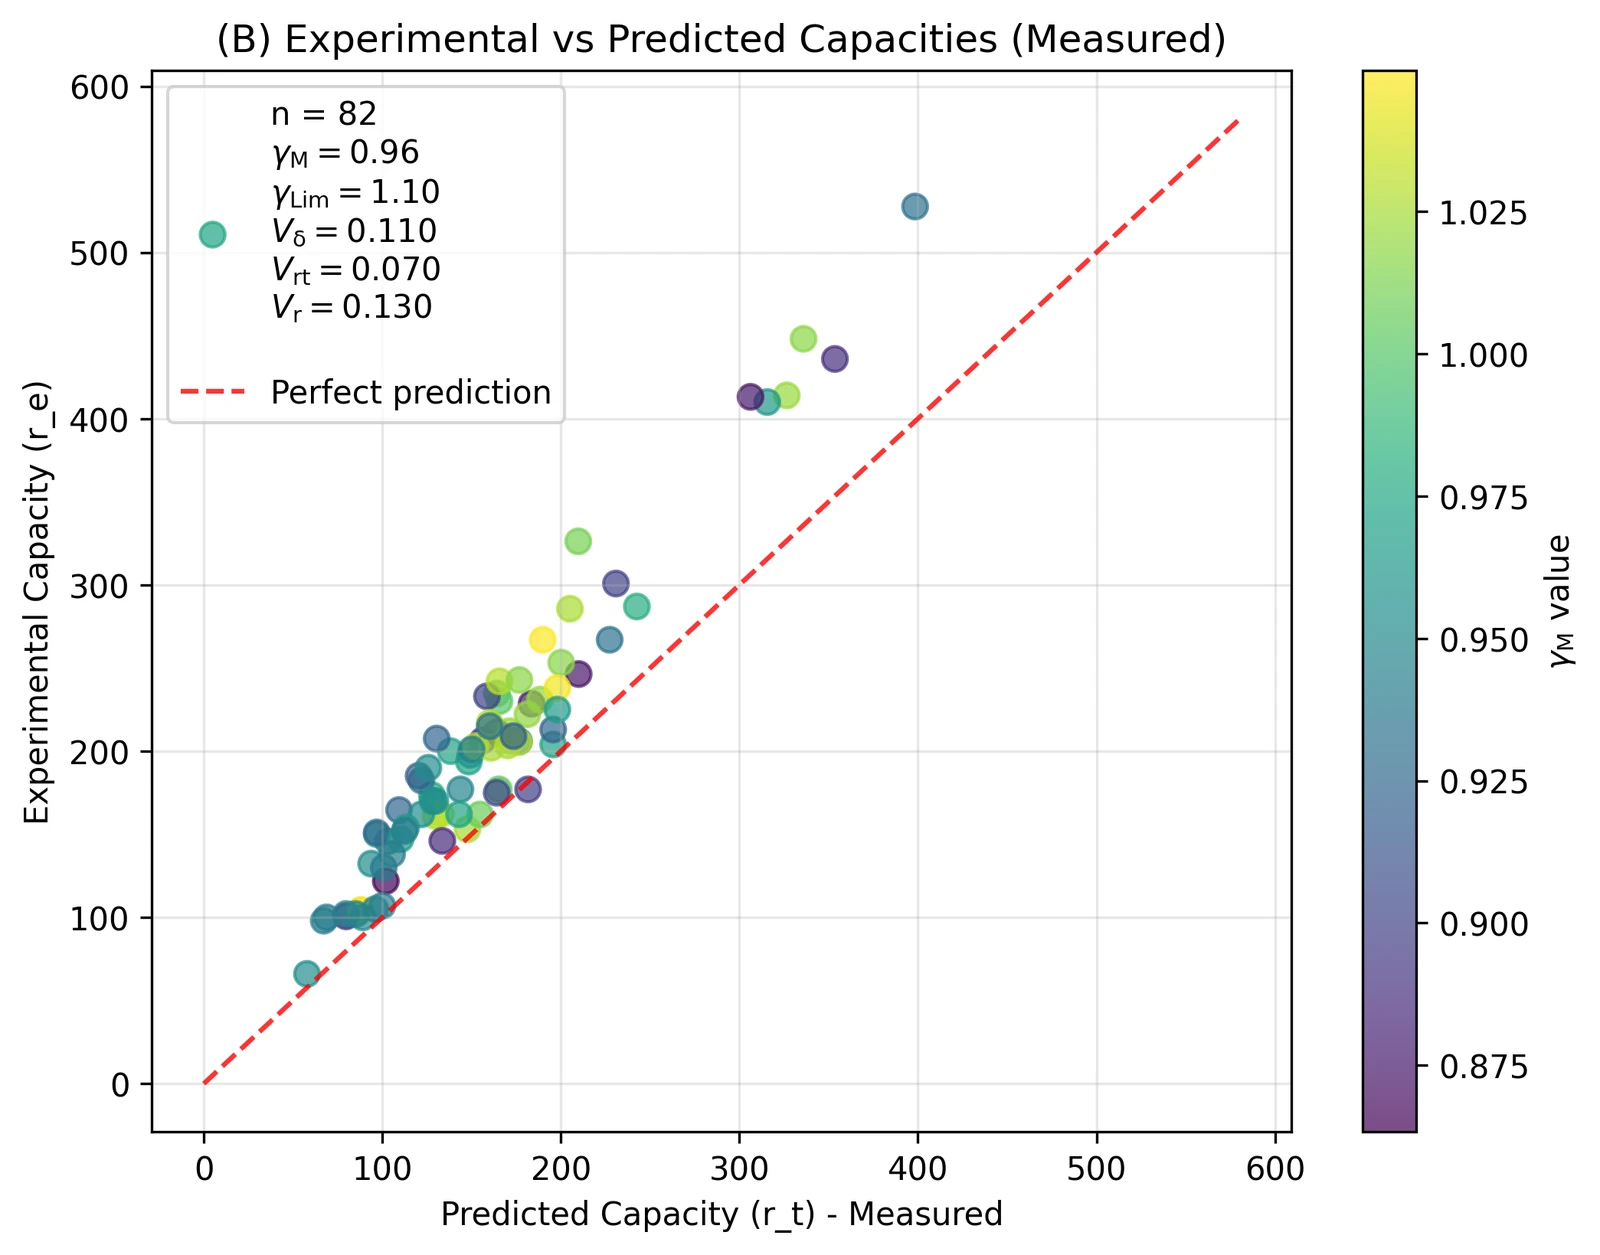
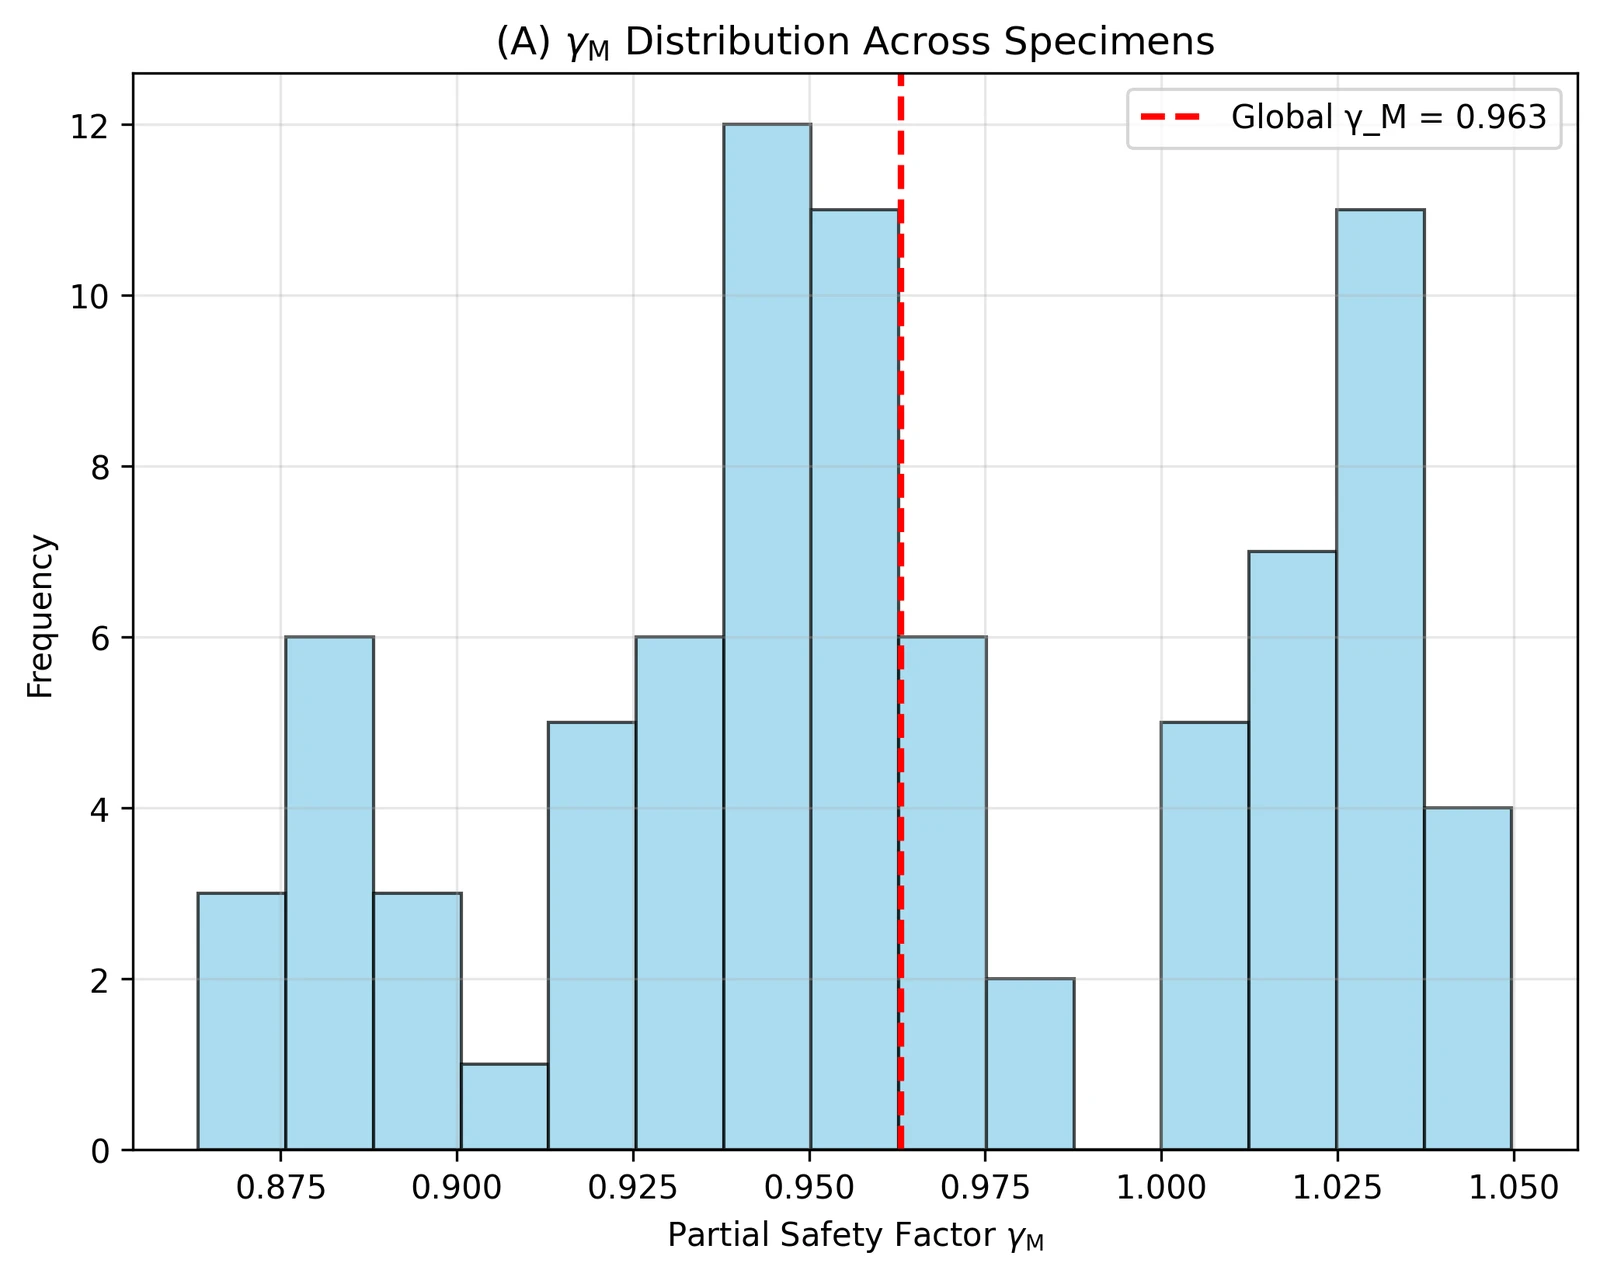
This means the design models from IDEA StatiCa provide reliable resistances closely aligned to the Eurocode reliability targets. The T-Stub CBFEM numerical design calculations do not require any additional safety factor for numerical models.
Conclusion
In addition to extensive verifications, validation of T-Stub connections is presented based on a testing campaign conducted by several researchers. The experiments involved different steel grades and connection geometries. Nevertheless, the reliability assessment of IDEA StatiCa Connection models with nominal properties and default settings proves sufficient reliability using the EN 1990 – Annex D procedure.
References
[1] Bursi, O. & Jaspart, J.-P. (1997). Benchmarks for Finite Element Modelling of Bolted Steel Connections. Journal of Constructional Steel Research. 43. 17-42. 10.1016/S0143-974X(97)00031-X.
[2] Piluso, V. & Faella, C. & Rizzano, G. (2001). Ultimate Behavior of Bolted T-stubs – II. Model Validation. Journal of Structural Engineering. 127. 694-704. https://ascelibrary.org/doi/10.1061/(ASCE)0733-9445(2001)127:6(694)
[3] Girao Coelho, A. & Bijlaard, F. S. K. & Simoes, L. (2004). Characterization of the Ductility of Bolted End Plate Beam-to-Column Steel Connections.
[4] Sabatino, R. (2007). Comportamento al Collasso di T-stubs Bullonati: Analisi Teorico-Sperimentale. Università degli Studi di Salerno.
[5] Latour, M. & Rizzano, G. (2012). Experimental Behavior and Mechanical Modeling of Dissipative T-Stub Connections. Journal of Structural Engineering. 138. 170-182. 10.1061/(ASCE)ST.1943-541X.0000435.
[6] Barata, P. & Ribeiro, J. & Rigueiro, C. & Santiago, A. & Rodrigues, J. P. (2014). Assessment of the T-stub Joint Component at Ambient and Elevated Temperatures. Fire Safety Journal. 70. 1-13. https://doi.org/10.1016/j.firesaf.2014.08.009.
[7] Anwar, G. (2017). Ultimate Deformation and Resistance Capacity of Bolted T-Stub Connections under Different Loading Conditions.
[8] Guo, H. & Liang, G. & Li, Y. L. & Liu, Y. (2017). Q690 High Strength Steel T-stub Tensile Behavior: Experimental Research and Theoretical Analysis. Journal of Constructional Steel Research. 139. 473-483. https://doi.org/10.1016/j.jcsr.2017.10.007
[9] Ydstebo, K. (2017). Capacity of Bolted T-stub Connections Between Different Materials Subjected to Tension and Thermal Load.
[10] Liang, G. & Guo, H. & Liu, Y. & Yang, D. & Li, S. (2019). A Comparative Study on Tensile Behavior of Welded T-stub Joints Using Q345 Normal Steel and Q690 High Strength Steel under Bolt Preloading Cases. Thin-Walled Structures. 137. 271-283. https://doi.org/10.1016/j.tws.2019.01.023.
[11] Zhao, X. & He, S. & Yan, S. (2021). Full-Range Behaviour of T-stubs with Various Yield Line Patterns. Journal of Constructional Steel Research. 186. 106919. https://doi.org/10.1016/j.jcsr.2021.106919.
[12] Lin, T. & Wang, Z. & Hu, F. & Hou, W. (2022). Comparison in Tensile Behaviour of Conventional and High-Strength Steel Welded-Plate Preloaded T-stubs. Structures. 43. 93-104.
https://doi.org/10.1016/j.istruc.2022.06.039.
[13] Xu, X. & Chen, S. & Yuan, H. (2024). Research on the Initial Tensile Stiffness of T-stub Based on Correlation. Engineering Reports. 6. https://doi.org/10.1002/eng2.12869
[14] Francavilla, A. B. & Faralli, A. C. & Latour, M. & Tan, P. J. (2025). Energy-Based Assessment of the Influence of the Nonlinearities on T-stub Ultimate Behaviour. Engineering Structures. 332. 120118.
https://doi.org/10.1016/j.engstruct.2025.120118.
[15] European Commission: Directorate-General for Research and Innovation, Cajot, L.-G., Dehan, V., Dekker, R. W. A., Haremza, C. et al., Standardization of safety assessment procedures across brittle to ductile failure modes (SAFEBRICTILE) – Final report, Publications Office, 2017, https://data.europa.eu/doi/10.2777/76892