All CSFM outputs are available
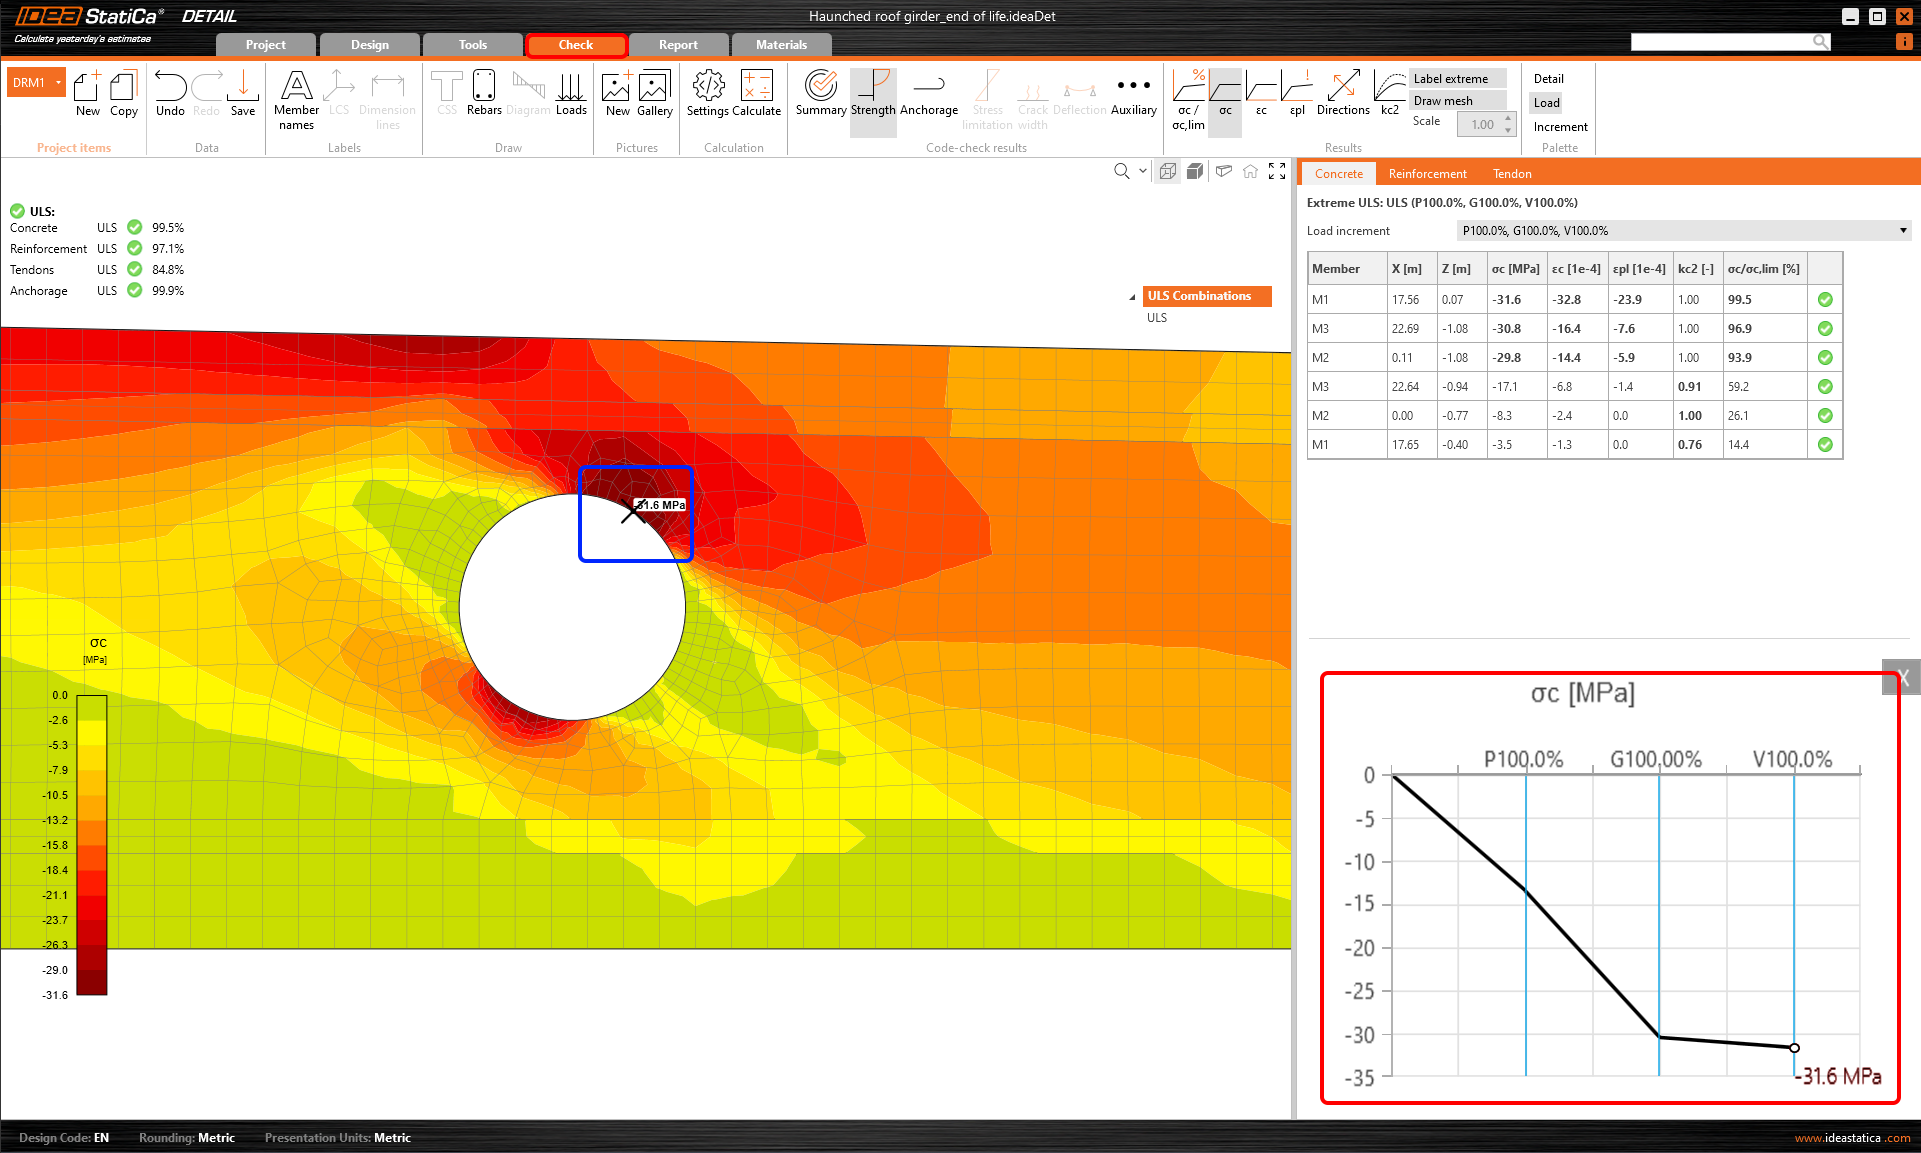
All CSFM results can be displayed as a tooltip by staying with your mouse pointer at the point of your interest for a few seconds or simply using the left-click button. The displayed value always corresponds to the result of the closest node of the finite element mesh of the reinforced concrete model. This functionality is available for all CSFM outputs and checks for all entities of the finite element model, i.e., concrete, reinforcement, and tendon.
Results in a Chart
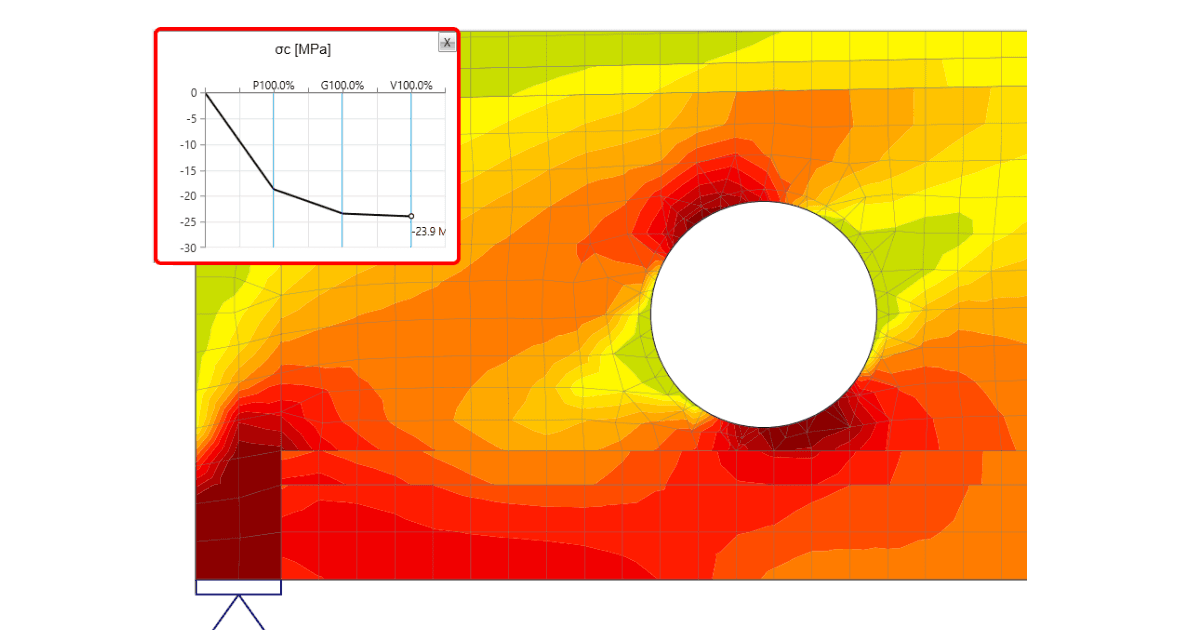
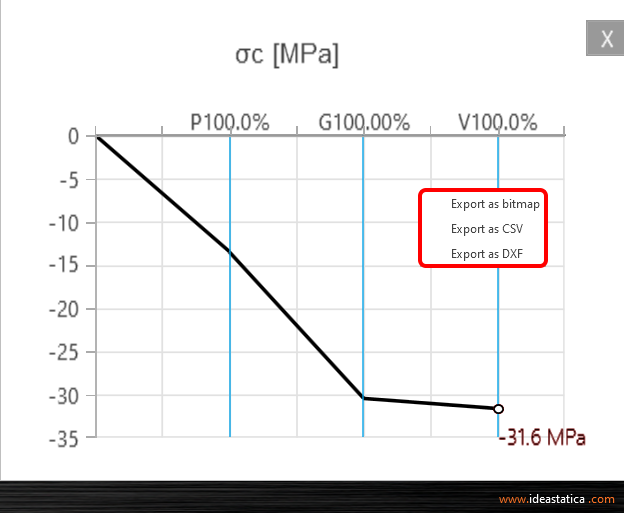
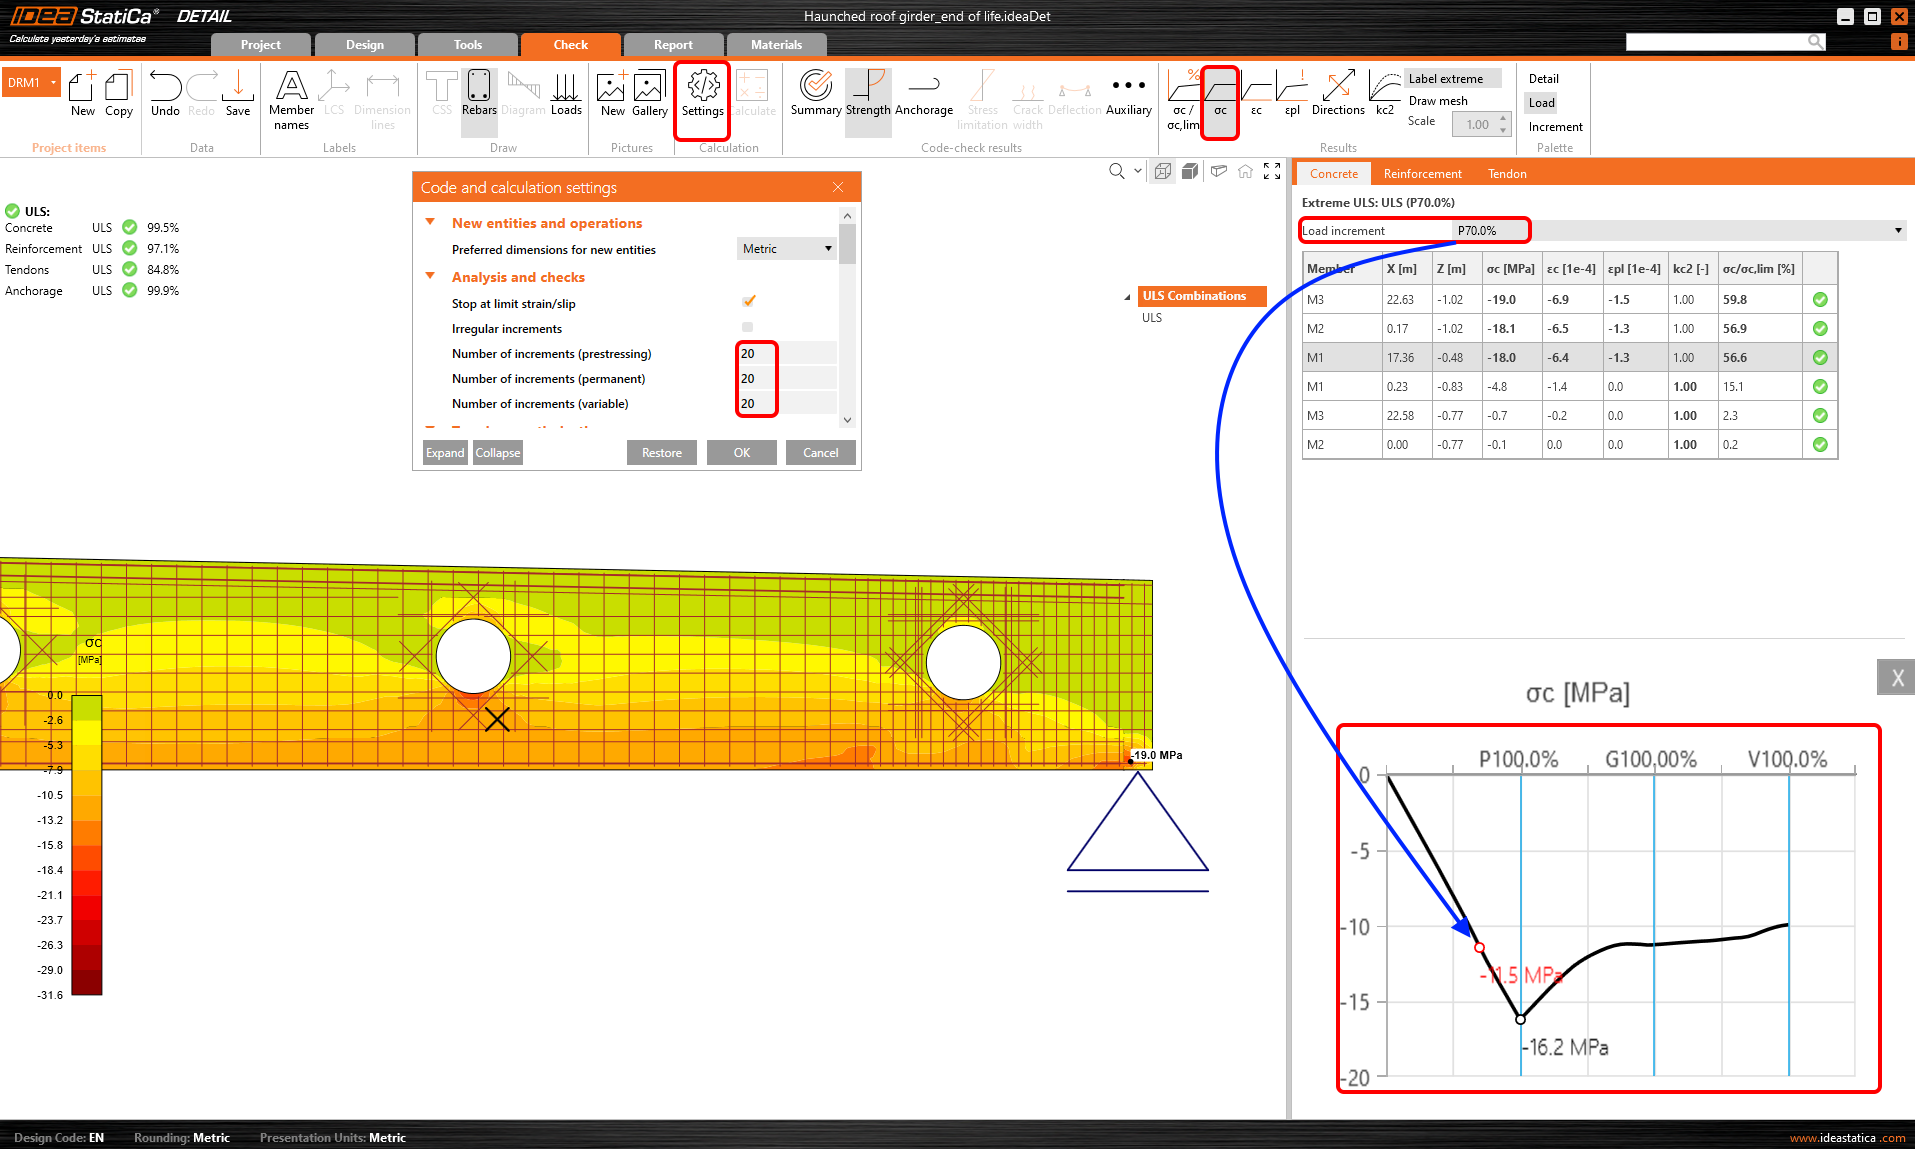
And there is more! Use the right-click button and observe another advanced functionality - result interpretation in a Chart. After clicking on a part of a structure (Shift+ left-click button or running the context menu by right-click button), the load-deformation curve or curve presents the development of the observed variable (stress, strain, crack width, etc.) is drawn in the upper-left corner of the main scene. The curve presents all load increments that were applied in CSFM analysis for the current load case or combination. The value of the load increment selected in the ribbon of Results is highlighted in the chart by the red color. The horizontal axis represents the applied load increment (P = 100% of applied prestressing, G = applied 100% of permanent load, V = applied 100% of variable load). The vertical axis represents the observed CSFM results, such as stresses, strains, deformation, crack width, anchorage forces, and others. The data from the chart can be exported to a bitmap, CSV, or DXF file using the context menu of the chart (right-click button).
The load-deformation curve is actually the capacity curve (or pushover curve) of the analyzed discontinuity region. So you can use these chart outputs when the structural seismic design is necessary for your project. In that case, you appreciate the data export to CSV file.
Tips on how to work efficiently with thorough results in IDEA StatiCa Detail
- staying on the point displays the tooltip with the currently observed result
- using left-click button displays the tooltip with the currently observed result
- using right-click context menu within the main scene offers a new possibility to display the detailed results in the chart, apart from the functionalities (Print, export to Bitmap, DXF and clipboard)
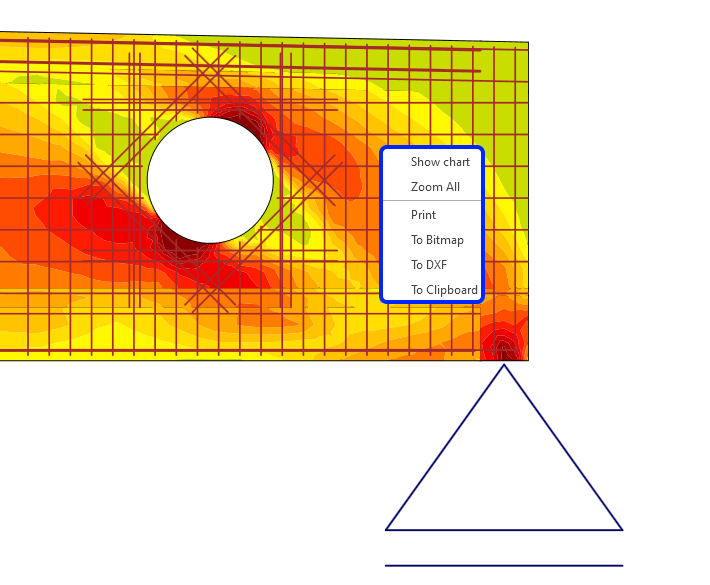
- using right-click context menu within the chart you can export the chart to bitmap, CSV or DXF
- set the number of the load increments to get the smooth capacity curves
- pressing Shift key+left click button within the analyzed structure, you get the corresponding result in the chart
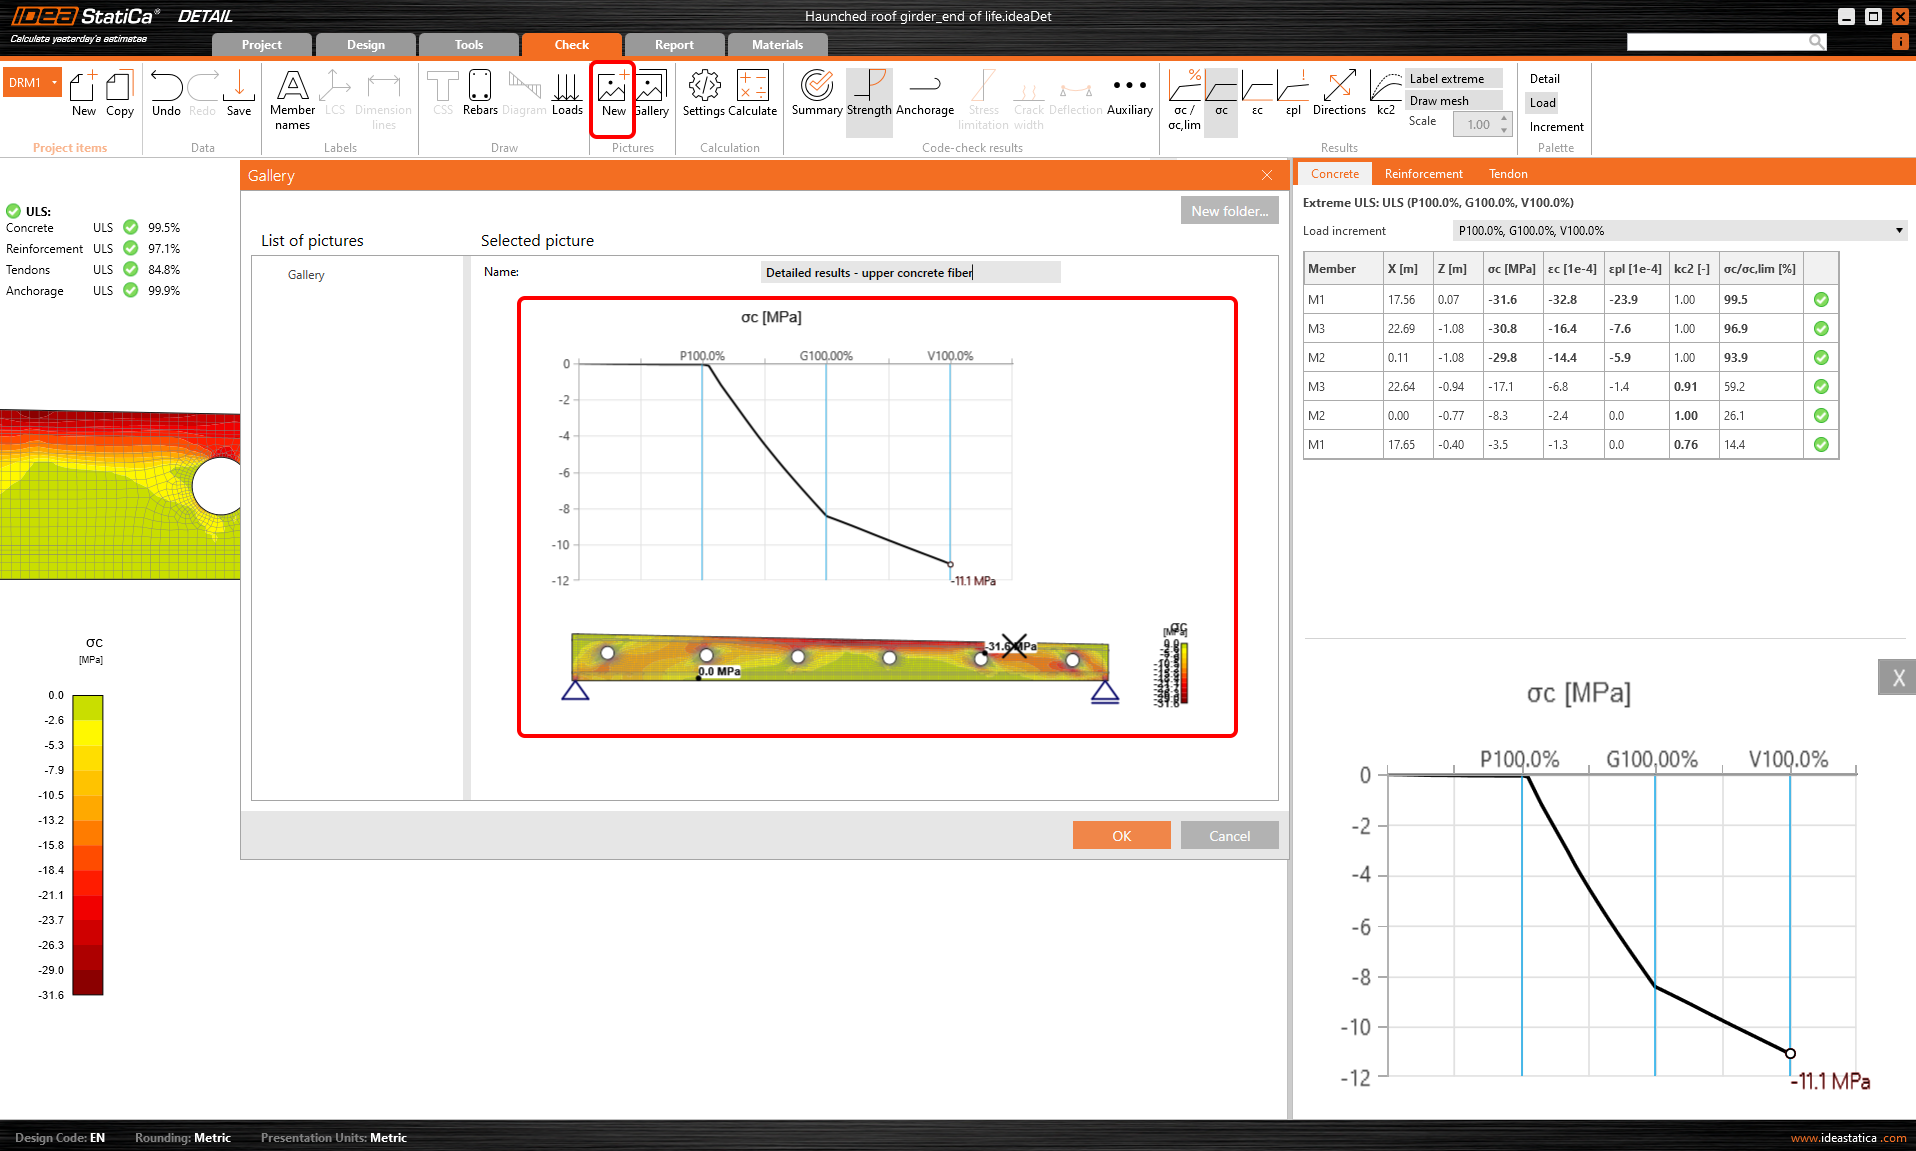
- save the detailed results to the Gallery and attach these snapshots to your report